Appearance
Output
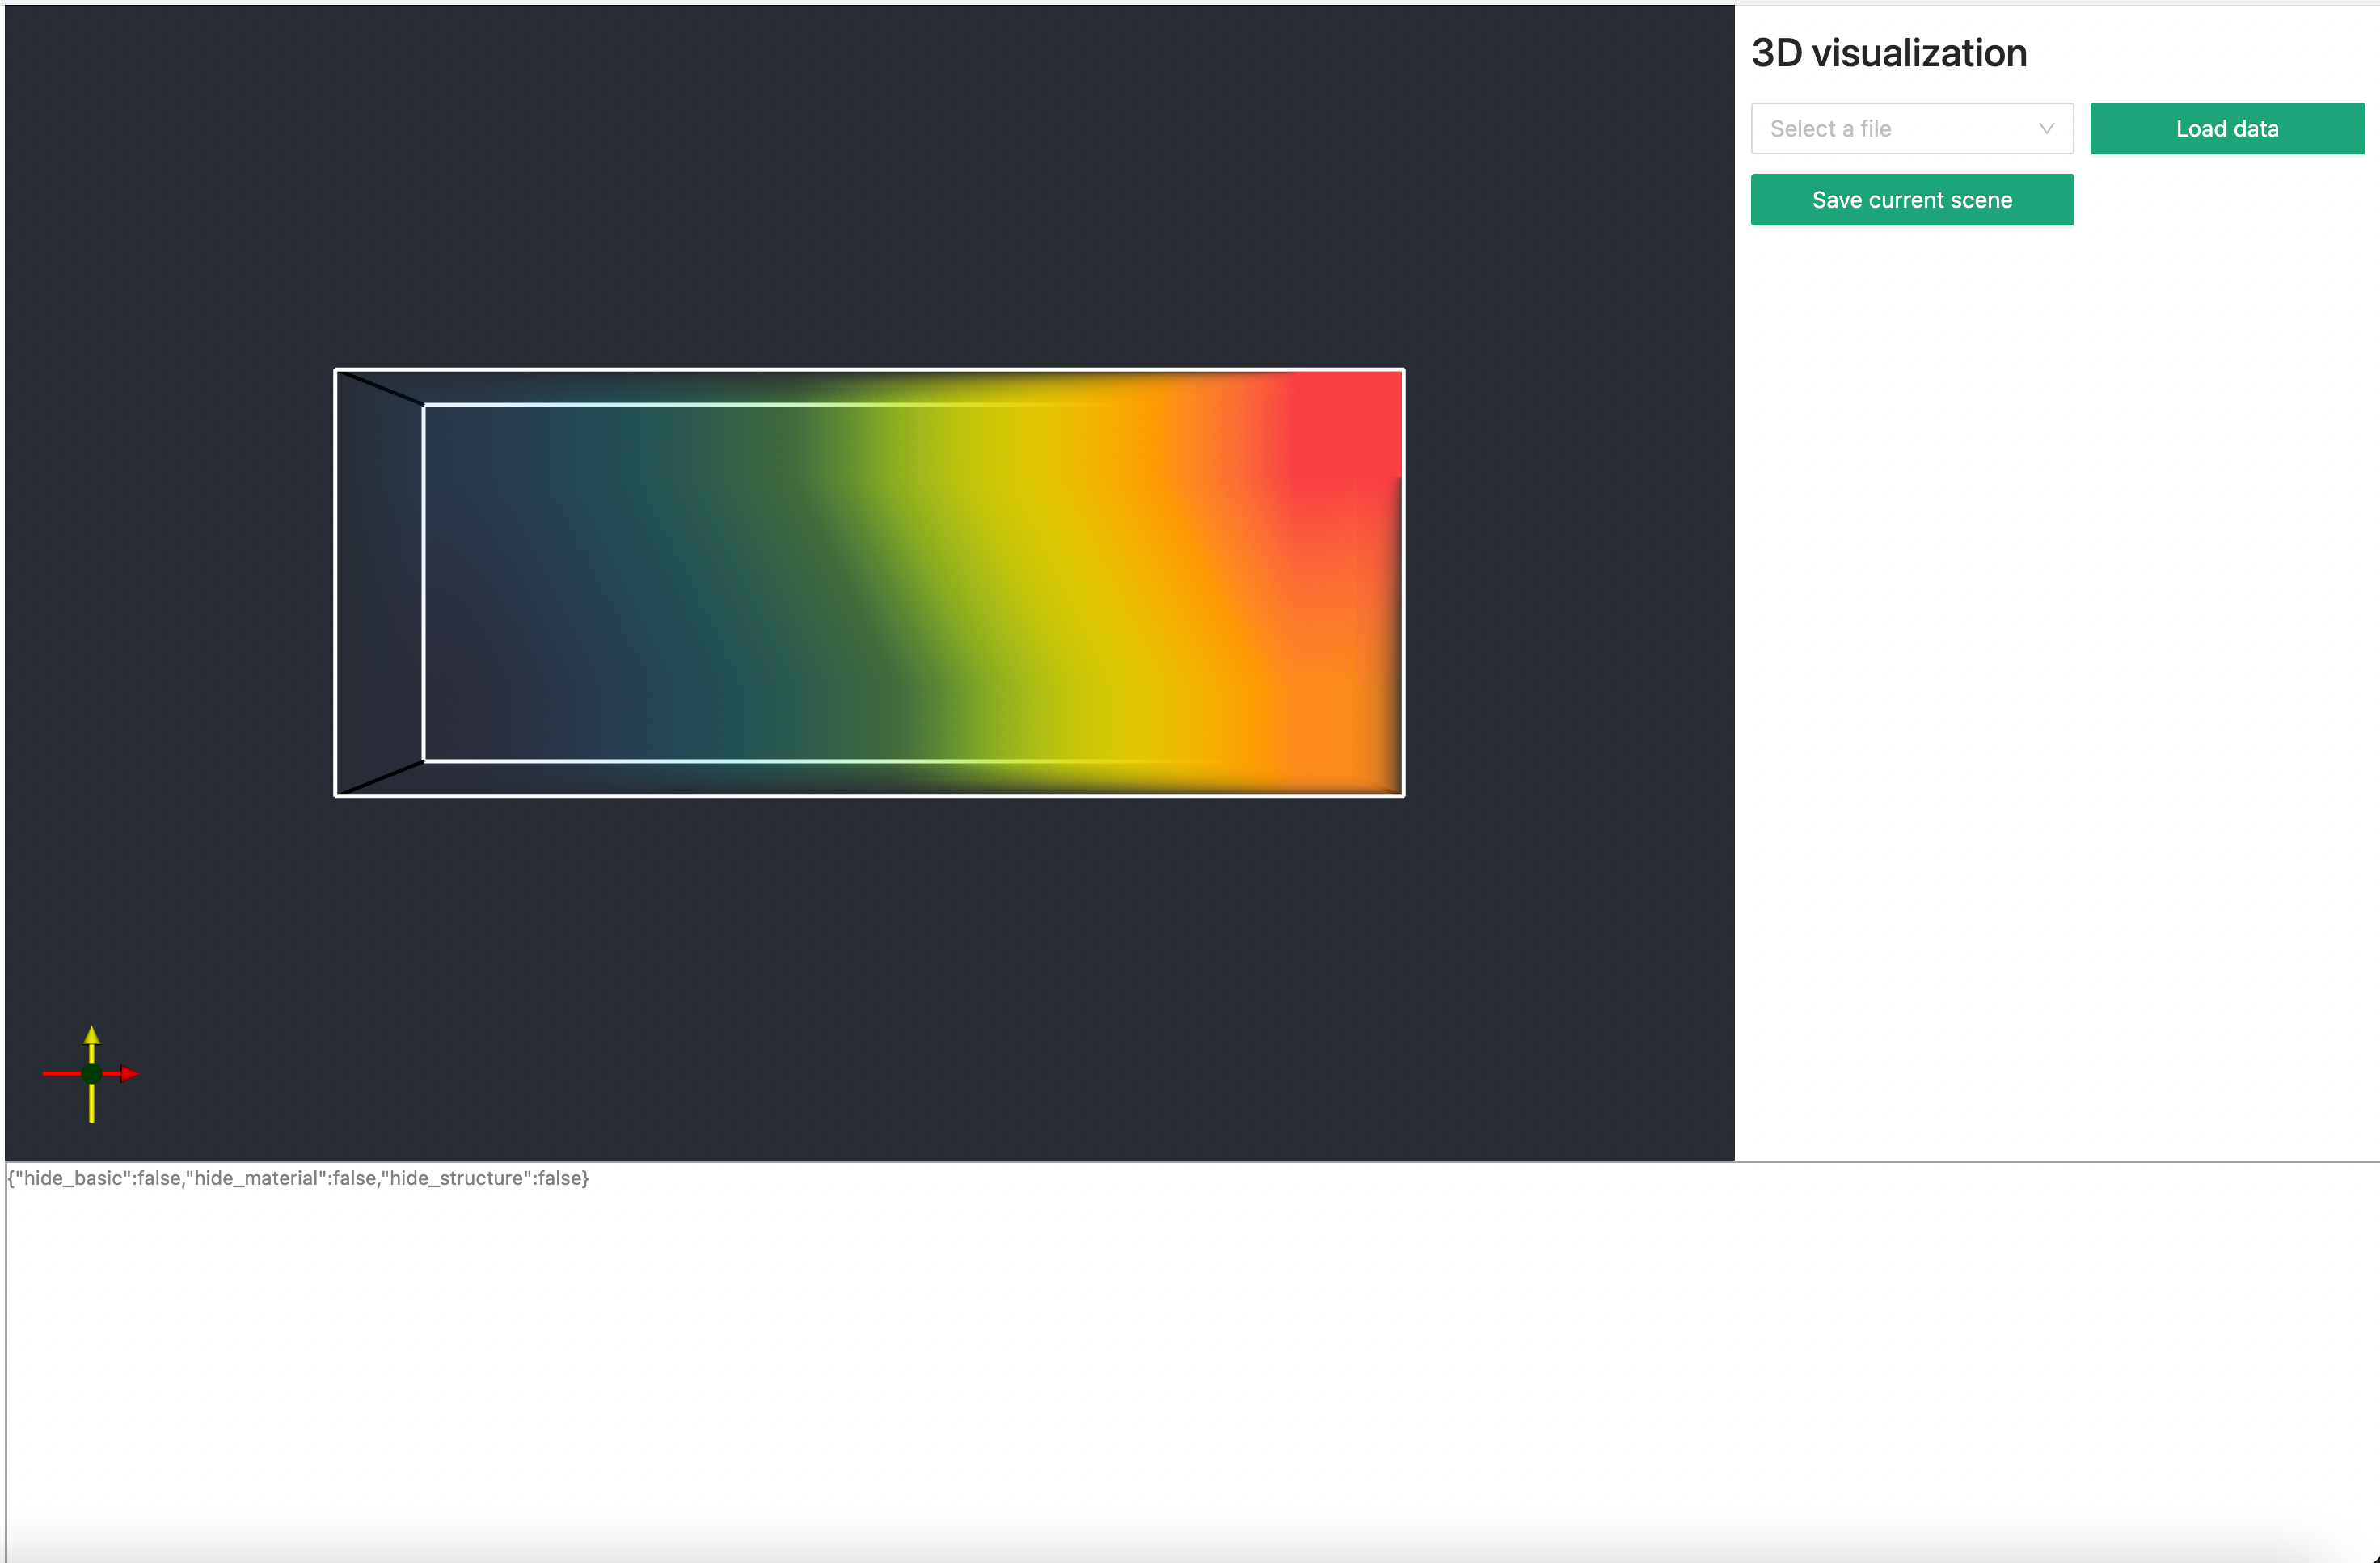
There are two types of output in the GUI, the 3D visualization in the upper part, and the console output in the lower part.
3D visualization
Disclaimer Visualization in our software is only to have a quick peek into the data rather than for comprehensive visualization or data exploration. For real visualization, we recommend using the software Paraview developed by Kitware. Or you can choose any software that supports the .vti format.
To visualize the 3D data .vti output files:
- Select a file: Use this dropdown menu to select available vti files in the folder that you have exported the most recent input.xml file.
- Load data: Click to load the data from the selected vti file into the visualization area. The default behavior is to visualize the first data array component in the file.
- Select a component: If the file you selected has more than one component to visualize, you need to use this dropdown menu to select different component of the vti data file.
Console output
Logging information will be printed to this area, the information includes:
- registration
- loading preference
- simulation screen output
Updated on 2023-03-18 at 16:45:26 -0400